aer_line_chart#
- ansys.stk.extensions.data_analysis.graphs.access_graphs.aer_line_chart(stk_object: Access, start_time: Any = None, stop_time: Any = None, step: float = 60, colormap: Colormap = None, time_unit_abbreviation: str = 'UTCG', formatter: collections.abc.Callable[[float, float], str] = None) Figure, Axes#
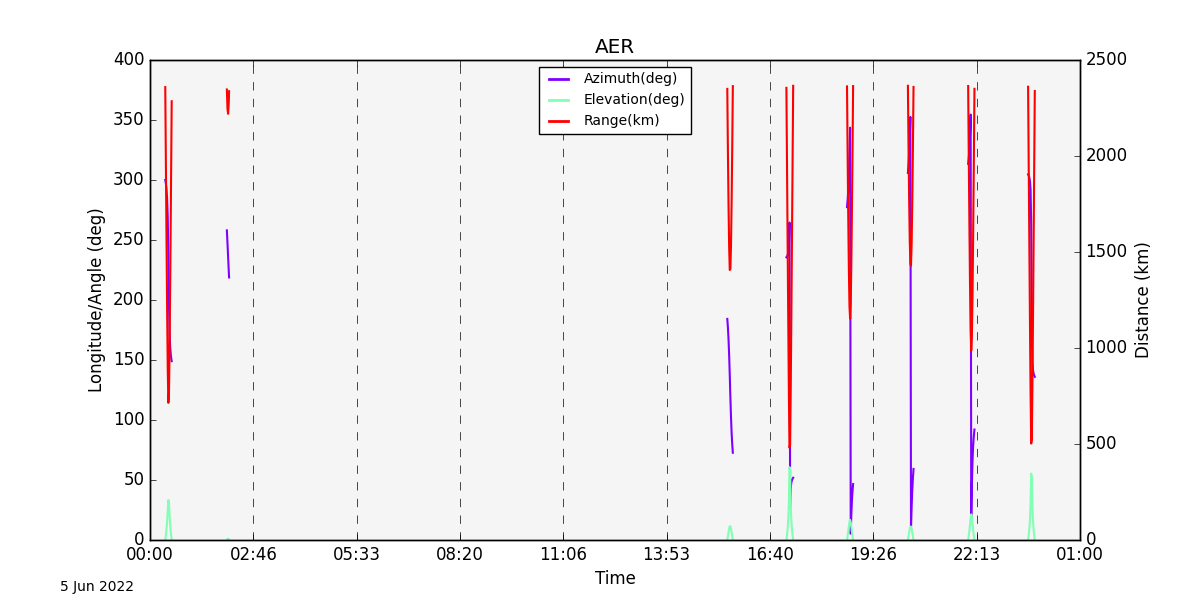
Create a plot of the azimuth, elevation, and range values for the relative position vector between the base object and the target object, during access intervals.
The relative position includes the effects of light time delay and aberration as set by the computational settings of the access. Az-El values are computed with respect to the default AER frame of the selected object of the Access Tool.
This graph wrapper was generated from AGI\STK12\STKData\Styles\Access\AER.rsg.
- Parameters:
stk_object :
AccessThe STK Access object.start_time :
AnyThe start time of the calculation (the default is None, which implies using the scenario start time).stop_time :
AnyThe stop time of the calculation (the default is None, which implies using the scenario stop time).step_time :
floatThe step time for the calculation (the default is 60 seconds).colormap :
ColormapThe colormap with which to color the data (the default is None).time_unit_abbreviation :
strThe time unit for formatting (the default is “UTCG”).formatter :
Callable[[float,float],str] The formatter for time axes (the default is None).- Returns:
FigureThe newly created figure.AxesThe newly created axes.
Import detail#
from ansys.stk.extensions.data_analysis.graphs.access_graphs import aer_line_chart