beta_angle_line_chart#
- ansys.stk.extensions.data_analysis.graphs.launch_vehicle_graphs.beta_angle_line_chart(stk_object: LaunchVehicle, start_time: Any = None, stop_time: Any = None, step: float = 60, colormap: Colormap = None, time_unit_abbreviation: str = 'UTCG', formatter: collections.abc.Callable[[float, float], str] = None) Figure, Axes#
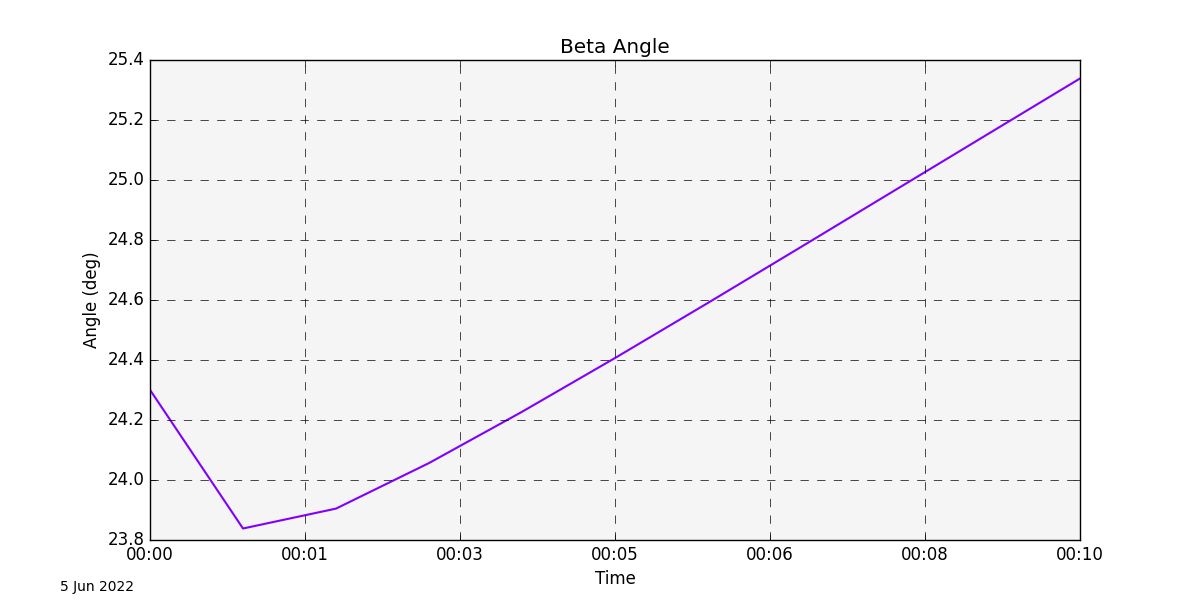
Plot the beta angle (i.e., the signed angle of the apparent vector to the Sun) over time, relative to the orbital plane.
The signed angle is positive when the apparent vector is in the direction of the orbit normal. The orbit normal (which is normal to the orbital plane) is parallel to the orbital angular momentum vector, which is defined as the cross-product of the inertial position and velocity vectors.
This graph wrapper was generated from AGI\STK12\STKData\Styles\LaunchVehicle\Beta Angle.rsg.
- Parameters:
stk_object :
LaunchVehicleThe STK LaunchVehicle object.start_time :
AnyThe start time of the calculation (the default is None, which implies using the scenario start time).stop_time :
AnyThe stop time of the calculation (the default is None, which implies using the scenario stop time).step_time :
floatThe step time for the calculation (the default is 60 seconds).colormap :
ColormapThe colormap with which to color the data (the default is None).time_unit_abbreviation :
strThe time unit for formatting (the default is “UTCG”).formatter :
Callable[[float,float],str] The formatter for time axes (the default is None).- Returns:
FigureThe newly created figure.AxesThe newly created axes.
Import detail#
from ansys.stk.extensions.data_analysis.graphs.launch_vehicle_graphs import beta_angle_line_chart