classical_orbit_elements_line_chart#
- ansys.stk.extensions.data_analysis.graphs.satellite_graphs.classical_orbit_elements_line_chart(stk_object: Satellite, start_time: Any = None, stop_time: Any = None, step: float = 60, colormap: Colormap = None, time_unit_abbreviation: str = 'UTCG', formatter: collections.abc.Callable[[float, float], str] = None) Figure, Axes#
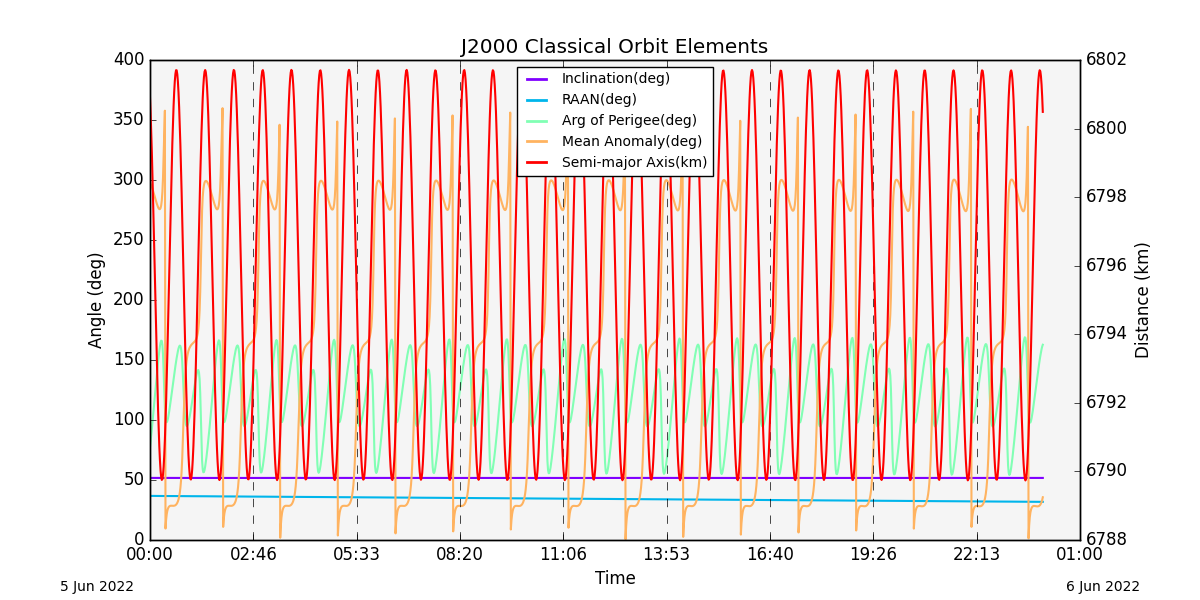
Create a plot of the angles and the semimajor axis of the classical osculating orbital elements, sometimes referred to as Keplerian elements, computed using ephemeris with respect to the object’s J2000 coordinate system, as a function of time.
Eccentricity is not plotted.
This graph wrapper was generated from AGI\STK12\STKData\Styles\Satellite\Classical Orbit Elements.rsg.
- Parameters:
stk_object :
SatelliteThe STK Satellite object.start_time :
AnyThe start time of the calculation (the default is None, which implies using the scenario start time).stop_time :
AnyThe stop time of the calculation (the default is None, which implies using the scenario stop time).step_time :
floatThe step time for the calculation (the default is 60 seconds).colormap :
ColormapThe colormap with which to color the data (the default is None).time_unit_abbreviation :
strThe time unit for formatting (the default is “UTCG”).formatter :
Callable[[float,float],str] The formatter for time axes (the default is None).- Returns:
FigureThe newly created figure.AxesThe newly created axes.
Import detail#
from ansys.stk.extensions.data_analysis.graphs.satellite_graphs import classical_orbit_elements_line_chart