polewandery_line_chart#
- ansys.stk.extensions.data_analysis.graphs.scenario_graphs.polewandery_line_chart(stk_object: Scenario, start_time: Any = None, stop_time: Any = None, step: float = 60, colormap: Colormap = None, time_unit_abbreviation: str = 'UTCG', formatter: collections.abc.Callable[[float, float], str] = None) Figure, Axes#
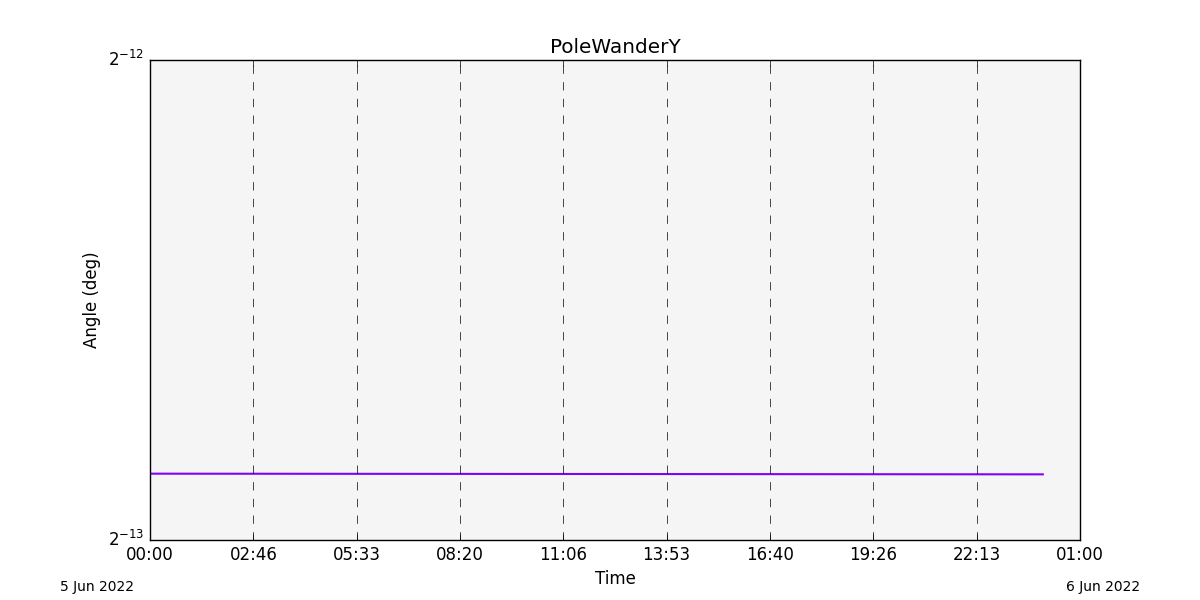
Create a plot of the Y component of pole wander over time.
Pole wander describes the unmodeled part of the Earth’s pole location.
This graph wrapper was generated from AGI\STK12\STKData\Styles\Scenario\PoleWanderY.rsg.
- Parameters:
stk_object :
ScenarioThe STK Scenario object.start_time :
AnyThe start time of the calculation (the default is None, which implies using the scenario start time).stop_time :
AnyThe stop time of the calculation (the default is None, which implies using the scenario stop time).step_time :
floatThe step time for the calculation (the default is 60 seconds).colormap :
ColormapThe colormap with which to color the data (the default is None).time_unit_abbreviation :
strThe time unit for formatting (the default is “UTCG”).formatter :
Callable[[float,float],str] The formatter for time axes (the default is None).- Returns:
FigureThe newly created figure.AxesThe newly created axes.
Import detail#
from ansys.stk.extensions.data_analysis.graphs.scenario_graphs import polewandery_line_chart